Participant characteristics
Comparison of the OAI cohort (Table 1) baseline characteristics between the structural progressors and no-progressors showed, for the former, a higher percentage of participants with a Kellgren-Lawrence (KL) score > 0–1, Western Ontario and McMaster Universities Osteoarthritis Index (WOMAC) scores and JSN, and a lower JSW. Age and BMI were also slightly higher in the structural progressor group, but although they reached statistical differences, they were not clinically significant.
For the TASOAC cohort (Table 2), a comparison between the two groups showed that the structural progressors have a higher WOMAC score and JSN, a lower JSW, and fewer men.
OAI and TASOAC cohorts have the same proportion for structural progressors (31%) and no-progressors (69%).
Comparison of the machine learning methodologies
With the OAI cohort, seven methodologies were compared using the 12 independent variables (Eq. 1). Figure 2 indicates the accuracy of the different ML methodologies in PVBSP forecasting at both the training and testing stages.
Comparison of the different machine learning methodologies in PVBSP in the OAI population. a Training (train) and b testing (test) stages accuracy for all the population. DT, decision tree; DT-SA-ELM, decision tree and self-adaptive ELM; ELM, extreme learning machine; KNN, K-nearest neighbor; OAI, Osteoarthritis Initiative; PVBSP, probability values of being structural progressors; RF, random Forest; SA-ELM, self-adaptive ELM; SVM, support vector machine; train, training stage; test, testing stage
Data from the whole population showed that in the training stage (Fig. 2a), both the SVM and RF methodologies had good performances in all the population for structural progressors and no-progressors (mean of about 93%). The other methodologies resulted in poorer performances, primarily related to the progressor population. To select the superior model in PVBSP forecasting, the performance of different methodologies was analyzed in individuals who had not played a role in the calibration process, the testing stage (Fig. 2b). Data showed that only SVM demonstrated excellent accuracy for both groups. SVM methodology was thus further used for the development of the prediction models.
Feature selection: sensitivity analysis
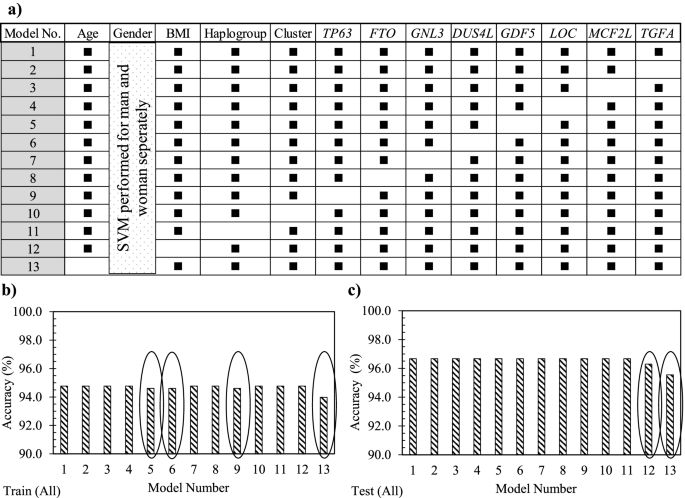
Using the whole OAI population, the effect of each 12 variables (Eq. 1) was evaluated in which all the models, except model 1, consisted of removing a variable (Fig. 3a). Data showed that model 1 had 94.8% accuracy in the training stage and 96.8% in the testing stage (Fig. 3b, c). Moreover, the removal of each variable demonstrated in the training stage (Fig. 3b) that not using GDF5 (model 5), DUS4L (model 6), TP63 (model 9), and age (model 13) as input variables slightly reduced the model’s accuracy in predicting PVBSP compared to model 1. At the testing stage (Fig. 3c), the variables BMI (model 12) and age (model 13) were also reduced compared to model 1. These data thus suggest that although the accuracy of these models is close, based on slight differences in training and testing stages, the important variables are age, BMI, TP63, DUS4L, and GDF5, and the following Eq. 2 can be considered as a model for PVBSP forecasting the progressor population:

Sensitivity analysis using the support vector machine. a Representation of the different input combinations. Model number (No.) 1 includes all 12 variables, and one variable is removed in each of the others. A black rectangle indicates the used variable, while the white cells the non-used variable. In b and c, accuracy data in the training (train) and testing (test) stages of the developed support vector machine (SVM) with the different variable combinations using the whole (all) population (n = 901) is shown. The ovals in b and c indicate the models having a lower accuracy when the given variable is removed. BMI, body mass index
$$mathrm{PVBSP}=mathrm{f}left(mathrm{age},mathrm{ BMI}, TP63, DUS4L, GDF5right)$$
(2)
When the population was divided into structural progressors and no-progressors, findings (data not shown) revealed that the difference found for the whole population was related to the progressor population. Hence, when only the progressor population was used, the model using all the 12 variables (model 1) showed an accuracy of 88.8% in the testing stage. For the no-progressors, there was no difference in the accuracy between the different models suggesting that the variables did not impact the outcome. Therefore, the no-progressor population was not detailed further.
Machine learning model development
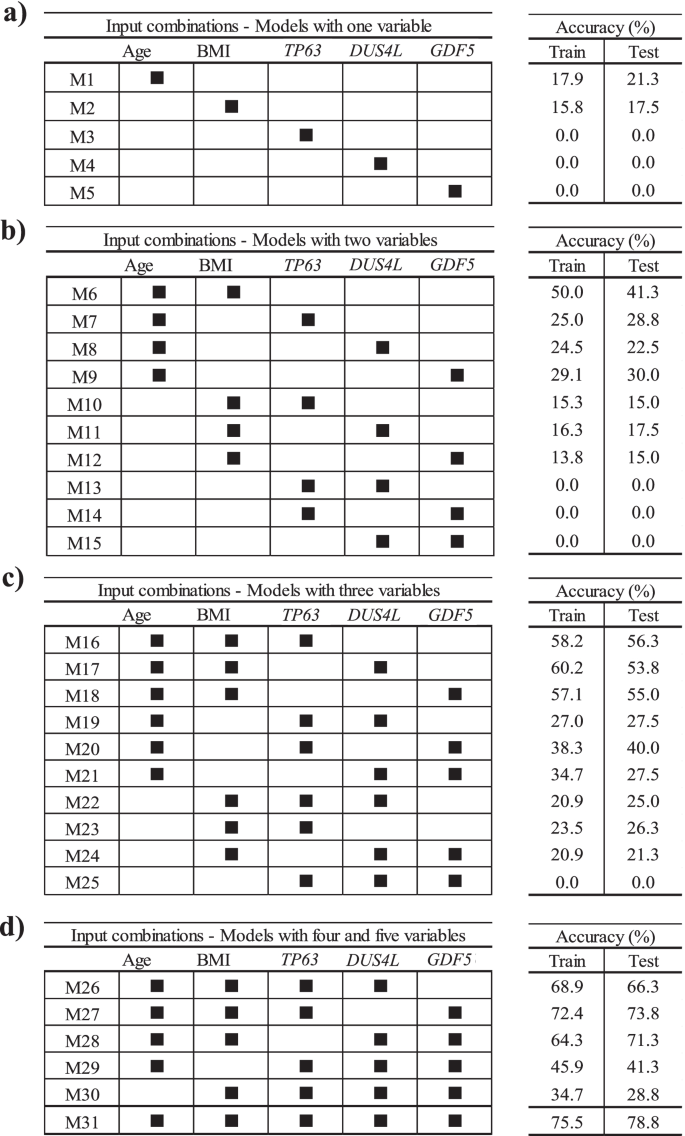
To find if lesser input variables can provide an accurate model, we further evaluated, by using the structural progressor population and the five variables as in Eq. 2, the scenarios of using one variable at a time followed by combining two to five variables. As illustrated in Fig. 4, 31 different ML models in PVBSP forecasting were developed. Data revealed that for models with only one variable (Fig. 4a), the accuracies of TP63 (M3), DUS4L (M4), and GDF5 (M5) at both training and testing stages were nil. Although the accuracy improved for age (M1) and BMI (M2), the numerical values (≤ 21.3%) were still very low. However, this improvement substantiates the importance of these two variables (age and BMI) as found in the sensitivity analysis (Fig. 3).

Finding the best input variable combinations. The combinations with the most important variables from sensitivity analysis for the progressor population used models built with a one variable, b two variables, c three variables, and d four and five variables. BMI, body mass index; M1–M31 number of models; train, training stage; test, testing stage
For the models with two variables (Fig. 4b), the highest accuracy (testing stage 41.3%) considered age and BMI simultaneously (M6). A comparison of the combination of each of these variables with age (M7–M9), with one consisting of age and BMI together (M6), showed that replacing BMI with TP63 (M7), DUS4L (M8), and GDF5 (M9) reduced the modeling accuracy in the testing stage by 12.5%, 18.8%, and 11.3%, respectively. However, if one of the inputs was BMI and the other two were one of the SNP genes (TP63 [M10], DUS4L [M11], GDF5 [M12]), the prediction accuracy was further reduced. Moreover, by not using age and BMI as one of the inputs of the models with two variables, we could not predict any of the progressors; the accuracy value was zero. These findings indicate that using TP63, DUS4L, and GDF5 without the risk factors cannot yield an efficient model in PVBSP forecasting.
As shown in Fig. 4c, adding one of TP63, DUS4L, or GDF5 as a variable to both age and BMI showed an increased accuracy. Models with three features that employed only one of the risk factors (M19–M21 for age and M22–M24 for BMI) had lower accuracy (range 21.3–40.0%) than the model with these two variables (M6, 41.3%). It should be noted that the simultaneous use of three variables without those of the two risk factors did not predict the progressors with high accuracy. Hence, the significant effect of age and BMI on PVBSP forecasting was confirmed.
For models with four and five variables (Fig. 4d), M26–M28 had higher accuracy than the best model offered among those using only three variables, i.e., M16. M27 demonstrated the best performance (testing stage, 73.8%). This model uses, in addition to age and BMI, TP63 and GDF5. The combination of DUS4L and GDF5 (M28) and DUS4L and TP63 (M26) were in the second and third place, respectively. As for the models with fewer variables (Fig. 4b, c), the non-simultaneous use of BMI and age (M29 and M30) led to a model with lower accuracy.
These results (Fig. 4) show that increasing the number of inputs is effective when both age and BMI are considered. However, the best performance (testing stage 78.8%) was obtained with M31, which considers the five variables as in Eq. 2.
Synergy of variables
The above data showed that, for the structural progressor population, the accuracy of M31 (five variables; testing stage, 78.8%) was lower than model 1 (12 variables; testing stage, 88.8%). Therefore, we assumed that some variables that are not considered in M31, including mtDNA haplogroup, cluster, FTO, GNL3, SUPT3H, MCF2L, and TGFA, could exert a synergistic effect with one or more variables in M31. This led to examining the synergy between the variables, and 66 new and different ML models were developed. Three impact levels were defined by comparing the results of each of these models with model 1 (Eq. 2) as the base model and according to the accuracy.
Table 3 illustrates, from highest to lowest, the impact effect between a fixed variable (variable 1) and one of the variables as listed in variable 2. Data revealed that the highest synergy impact was found for age with (i) BMI, (ii) GNL3, (iii) MCF2L, and (iv) FTO. Those having a moderate impact were age with (i) mtDNA haplogroup, (ii) GDF5, (iii) SUPT3H, (iv) TGFA, and (v) TP63; BMI with (vi) TP63 and (vii) SUPT3H, and (viii) GDF5 and MC2FL.
According to the highest and moderate impacts, two different scenarios were defined to find the optimum model (Table 4). In scenario 1, in addition to the combination of age and BMI, the factors found to have a high impact on synergies, GNL3, MCF2L, and FTO, were added one at a time to M31. In scenario 2, as the mtDNA haplogroup showed a moderate impact with age, it was used in addition to age and BMI as a fixed input variable, and the other SNP genes, TP63, FTO, GNL3, DUS4L, GDF5, SUPT3H, and TGFA, were added one at the time or in combination. All of the SNP genes were tested to ensure the accuracy and reliability of the final results.
Scenario 1
Three different models (Table 4, scenario 1) named M32-1 to M31-3 were defined and included the five variables of the model M31 plus GNL3, MCF2L, or FTO, respectively. The performance in the testing stage of M32-1 (82.7%), M32-2 (81.3%), and M32-3 (85.0%) was slightly lower than model 1 (12 variables, 88.8%) but higher than that of M31 (five variables, 78.8%). M32-3 (M31 + FTO) outperformed M31 and M31-2. Therefore, and to have a model with a lower number of variables, M32-3 appeared to be a very good model and consisted of:
$$mathrm{PVBSP}=mathrm{f}left(mathrm{age},mathrm{ BMI}, TP63, DUS4L, GDF5, FTOright).$$
(3)
Scenario 2
To verify if we could obtain a better accuracy with fewer variables, we analyzed another scenario consisting of age, BMI, and mtDNA haplogroup as fixed variables with one to seven SNP genes. This resulted in 109 combinations with four to ten variables and was named MH1-109. The analyses of all input combinations showed that the best accuracy range at the testing stage was 80.0–88.8%, and only those are represented in Table 4, scenario 2. Data showed that for four models with six to nine variables, the accuracy was identical (MH46, MH80, MH101, and MH106) in the testing stage (88.8%) as the one for model 1 with 12 variables. The model MH2 with four variables was at 80.0%, and MH17 with five variables at 82.5%. Given that the optimum model should not only have an excellent accuracy but the least number of variables, MH17 was selected as the optimal model:
$$mathrm{PVBSP}=mathrm{f}left(mathrm{age},mathrm{ BMI},mathrm{ mtDNA haplogroup}, FTO, SUPT3Hright).$$
(4)
Effect of each variable on the optimum model, MH17
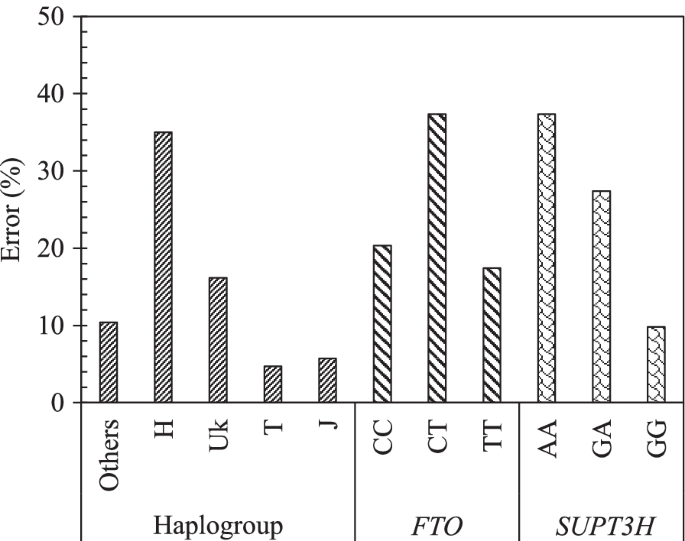
The effect of each variable on the model MH17 was done using sensitivity analysis. Figure 5 demonstrates the impact of each SNP mtDNA haplogroup (others, H, Uk, T, J) and gene genotype for FTO (CC, CT, and TT) and SUPT3H (AA, GA, and GG) in PVBSP forecasting. The high percentage of error indicates the high impact of the studied variable.

Effect of each variable of the model MH17. Impact of each mtDNA haplogroup and genotype alleles on the accuracy of the model MH17: PVBSP = f(age, BMI, mtDNA haplogroup, FTO, SUPT3H) for the progressor population. The high percentage of error indicates the highest impact of the variable. rs8044769 at FTO, presence of CC and CT, absence of TT: the risk allele C; rs10948172 at SUPT3H absence of AA, presence of GA and GG
Data showed that the mtDNA haplogroup H has the highest impact with an error of 35.0%, followed by UK with 16.1%, and ≤ 10% for the mtDNA haplogroup others, T, and J. FTO and SUPT3H both showed an identical highest error (37.3%) for both the presence of CT and absence of AA, respectively. The lowest error of FTO and SUPT3H was attained for the absence of TT (17.4%) and the presence of GG (9.8%), respectively.
Validation of the developed models using cross-validation and reproducibility with an external cohort (TASOAC)
The performance of M32-3 (Eq. 3) and MH-17 (Eq. 4) models when using the ten repetitions of tenfold cross-validation showed an average accuracy of 95.1% ± 2.1 for M32-3 and 94.6% ± 2.1 for MH-17 (Additional file 7: Fig. S4).
Reproducibility experiment with the external cohort TASOAC also demonstrated an excellent accuracy for both M32-3 (90.5%) and MH17 (85.7%), confirming the reliability and performance of these two developed ML models in the early detection of at-risk knee OA structural progressors.